Miljögeoadventure
What does the XRF - Measurements tell us?
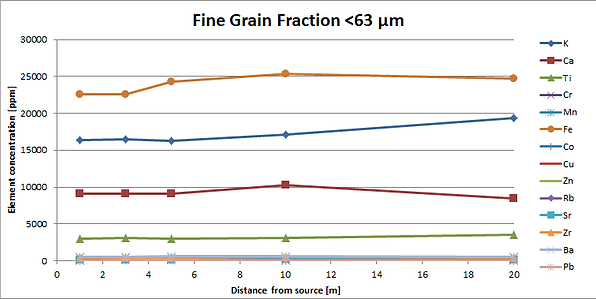
First we wanted to get an overview of the elements in our samples. So we plotted the whole element supply that we got from the XRF-measurements. We measured the grain size <63 µm, which represents the grain sizes of silt and clay and the grain size >63 µm which is sand and gravels.
Picture 1
Picture 2
Comparing these two diagrams, it is obvious that the main elements occurring in the samples are iron, potassium, calcium and titanium. These elements are of natural origin. The other elements are having lower concentrations. The lower concentrated elements can be seen below.
Picture 3
Picture 4
Comparing both diagrams it can be seen that there is no significant difference within the element concentrations in the fine and coarse fraction as it might be expected. Pollutants as copper, lead, cadmium, zinc and arsenic are not showing high concentrations in both fractions and all samples. Arsenic is an exception here. It is only detected within the coarse fraction and there only within two samples (samples 2 and 5).
As the differences within the element distribution between the coarse and fine grain sizes are relatively low, we are able to use the fine fraction for interpretations and can then translate the results into the coarse fraction.
Picture 5
Picture 6
Taking a closer look at the possible pollutants within the fine fraction it can be seen that all of them have a decreasing trend, the same applies to the bulk compostion with an exeption to cobalt. Cobalt seems to strongly increase with increasing distance from the source. Additionally its concentration as well as the concentration for cadmium are in a range twice as high as zinc, lead and copper.
Possible explanations to this can be found within the discussion part.


